Debug  dbg;
// text log, menu `Scripts / View execution log`
DebugLog  log = dbg.log();
// viewport log
DebugDraw  drw = dbg.draw();
log`) and graphic viewport elements (`drw`) of Coat.void main() {
log.clear();
drw.clear().color( 0xFFFFEE00 );
// ...
}What can we type to log?
// the concrete value of variable
float  delta = 1.2345;
log += delta;
// math result
// @see AngelScript math functions
log += pow( a, 3 ) * sqrt( 2 ) / 12;
// note
log +=
    "This is a debug-note."
    " We do treat variables provisionally as constants.";
// all local variables
log += dbg.vars();
// or (any longe, where more one variant, write without "or")
log += dbg.variables();
// all global variables
log += dbg.gvars();
log += dbg.globalVariables();
// current callstack
log += dbg.callstack();
// mesh like text
Builder  builder;
const Mesh  a = builder.cylinder()
  .positionTop( Vec3( 0, 120, 0 ) )
  .positionBottom( Vec3( 0, 0, 0 ) )
  .radiusTop( 50 )
  .radiusBottom( 50 )
  .details( 0.1 )
  ();
log += a;
What can we display in the viewport?
// point( position, color )
drw.point( Vec3( 50, 0, 0 ) );
drw.point( Vec3( 50, 60, 0 ), Color( 0xFFAAFF33 ) );
// line( startPosition, endPosition, startColor, endColor )
drw.line( Vec3( 0, 0, 0 ), Vec3( 100, 50, 25 ) );
drw.line( Vec3( 0, 50, 0 ), Vec3( 0, 200, 25 ),
    Color( 0xFF33FF33 ) );
drw.line( Vec3( 100, 120, 0 ), Vec3( 100, 250, 25 ),
    Color( 0xFFAA0000 ), Color( 0xFF0000AA ) );
// circle( position, normal, radius, color )
drw.circle( Vec3( 0, 0, 0 ), Vec3( 100, 50, 25 ), 20 );
drw.circle( Vec3( 0, 50, 0 ), Vec3( 0, 200, 25 ), 50,
    Color( 0xFF55FFAA ) );
// sphere( position, radius, color )
drw.sphere( Vec3( 0, 0, 0 ), 15 );
drw.sphere( Vec3( 0, 50, 0 ), 45,
    Color( 0x9955FFAA ) );
// triangle( A, B, C, colorA, colorB, colorC )
const Vec3  a( 0, 0, 0 );
const Vec3  b( 80, 30, 70 );
const Vec3  c( 10, 25, 100 ) );
drw.triangle( a, b, c );
drw.triangle( a, b, c,
    Color( 0x77AA0000 ) );
drw.triangle( a, b, c,
    Color( 0xFFAA0000 ), Color( 0xFF00AA00 ), Color( 0xFF0000AA ) );
// note( position, text )
drw.note( Vec3( 0, 0, 0 ),  "Note A" );
drw.note( Vec3( 0, 30, 0 ), "Note B",
    Color( 0xFF33FF33 ) );
drw.note( Vec3( 0, 0, 20 ),  111 );
drw.note( Vec3( 0, 30, 20 ), 222.51,
    Color( 0xFF33FF33 ) );
Complex visualization can be separated to layers to show / hide them separately. This can be done easily:
drw += "My 1";
drw.layer( "My 1" );
// drawing in the layer `My 1`
// ...
drw += "My 2";
// drawing in the layer `My 2`
// ...
Vectors, matrix, boxes (know what is AABB?), etc. won't be here: obviously, typing / visualization are simple:
log += MyObject;
drw += MyObjectWhichCanBeDraw;
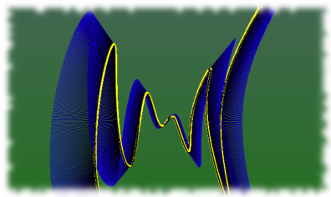
Lastly, a smallest example of using 3D-Coat's possibilities for quick 3D-visualization.
Debug  dbg;
DebugDraw  drw = dbg.draw();

void main() {

    drw.clear().color( 0xFFFFEE00 );
    Step( 1 );

    // parameter function
    const float  S = 10;
    const float  D = 180 * 4;
    const float  step = 0.5;
    for ( float t = -D; t <= D; t += step ) {
        const float  angle = t * 3.14 / 180;
        const float  x = t * sin( angle ) * sin( angle );
        const float  y = x * cos( angle );
        const float  z = y * cos( angle ) * cos( angle );
        const Vec3  p( x, y, z );
        drw.vector( p * S, p * S / 2,
            Color( 0xFF000000 ), Color( 0xFF1100BB ) );
        drw.sphere( p * S, 100, Color( 0xFFFFEE00 ) );
        // the script working too fast) push a pause
        if ( ceil( x * y * z * S ) % 5 == 0 ) {
            Step( 1 );
        }
    } // for ...
}
Result

Комментариев нет:
Отправить комментарий